
Vivian Nguyen
I'm
About

Data Analyst / Business Intelligence Analyst
I love transforming sales and customer data into meaningful insights, and continuously developing the skills that move me forward in my analytics career.
WHAT I OFFER
- Analyse sales & customer behavior to identify trends, opportunites, and performance gaps.
- Build dashboards and reports that support data-driven decisions across commercial and operational teams.
- Collaborate with cross-functional stakeholders to translate business questions into analytical solutions with clear insights and recommendations.
TOOLS I WORK WITH
Skills
Technical Skills
Excel 90%
Python 90%
SQL 90%
Power BI 80%
Tableau 75%
Transferable Skills
Analytical Thinking 95%
Stakeholder Communication 90%
Problem-Solving 85%
Attention to Detail 95%
Adaptability & Learning 90%
Resume
FEB 2023 – JUN 2024
Macquarie University
Master of Business Analytics
Sydney, Australia
- GPA: 81.6/100
- Awarded Highest Achievement in Big Data (Semester 2, 2023)
MAY 2022 - NOV 2022
University of Wollongong
Master of Business Analytics
Sydney, Australia
- GPA: 83.5/100
- Outstanding Academic Trimester 2 2022
OCT 2017 – SEP 2021
National Economics University
Bachelor of Business Management
Hanoi, Vietnam
- GPA: 83.1/100
- Study Promotion Scholarship for top 5% of students (Semester 2, 2021)
SEP 2024 – DEC 2025
EssilorLuxottica
Customer Support Specialist
Sydney, Australia
- Analysed escalation and order patterns with regional managers to highlight recurring issues, providing insights into updated service processes and reduced repeat escalations.
- Consistently met SLA and quality targets across inbound and outbound service channels, protecting key service KPIs while maintaining strong relationships with clients.
- Reduced manual handling time per escalation case by streamlining SAP CRM workflows and documenting standard steps used by the team.
- Partnered with supply chain and product teams to flag order, returns and availability data issues to improve stock allocation decisions and reduce friction for key accounts.
OCT 2023 – SEP 2024
Sunglass Hut
Retail Associate
Sydney, Australia
- Exceeded monthly sales targets by 12% on average by using customer behaviour insights to guide product recommendations.
- Reviewed weekly and monthly KPIs with store leadership to adjust store strategies based on conversion rate, footfall and AOV trends.
JUN 2021 – JAN 2022
Lexus
Business Assistant — Analyst
Hanoi, Vietnam
- Extracted, cleaned and reconciled data from Cybersoft ERP and Excel, improving data accuracy and reducing manual reporting time.
- Prepared monthly sales performance reports and dashboards covering sales trends, pricing changes and operational KPIs for management and Toyota Headquarter.
- Performed trend and demand analysis by model, trim, customer type and sales channel, informing stock planning and allocation decisions so that inventory better matched local demand patterns.
Portfolio
Here's a selection of projects showcasing my analytical skills
- ALL
- POWER BI
- TABLEAU
- SQL
- EXCEL
- PYTHON
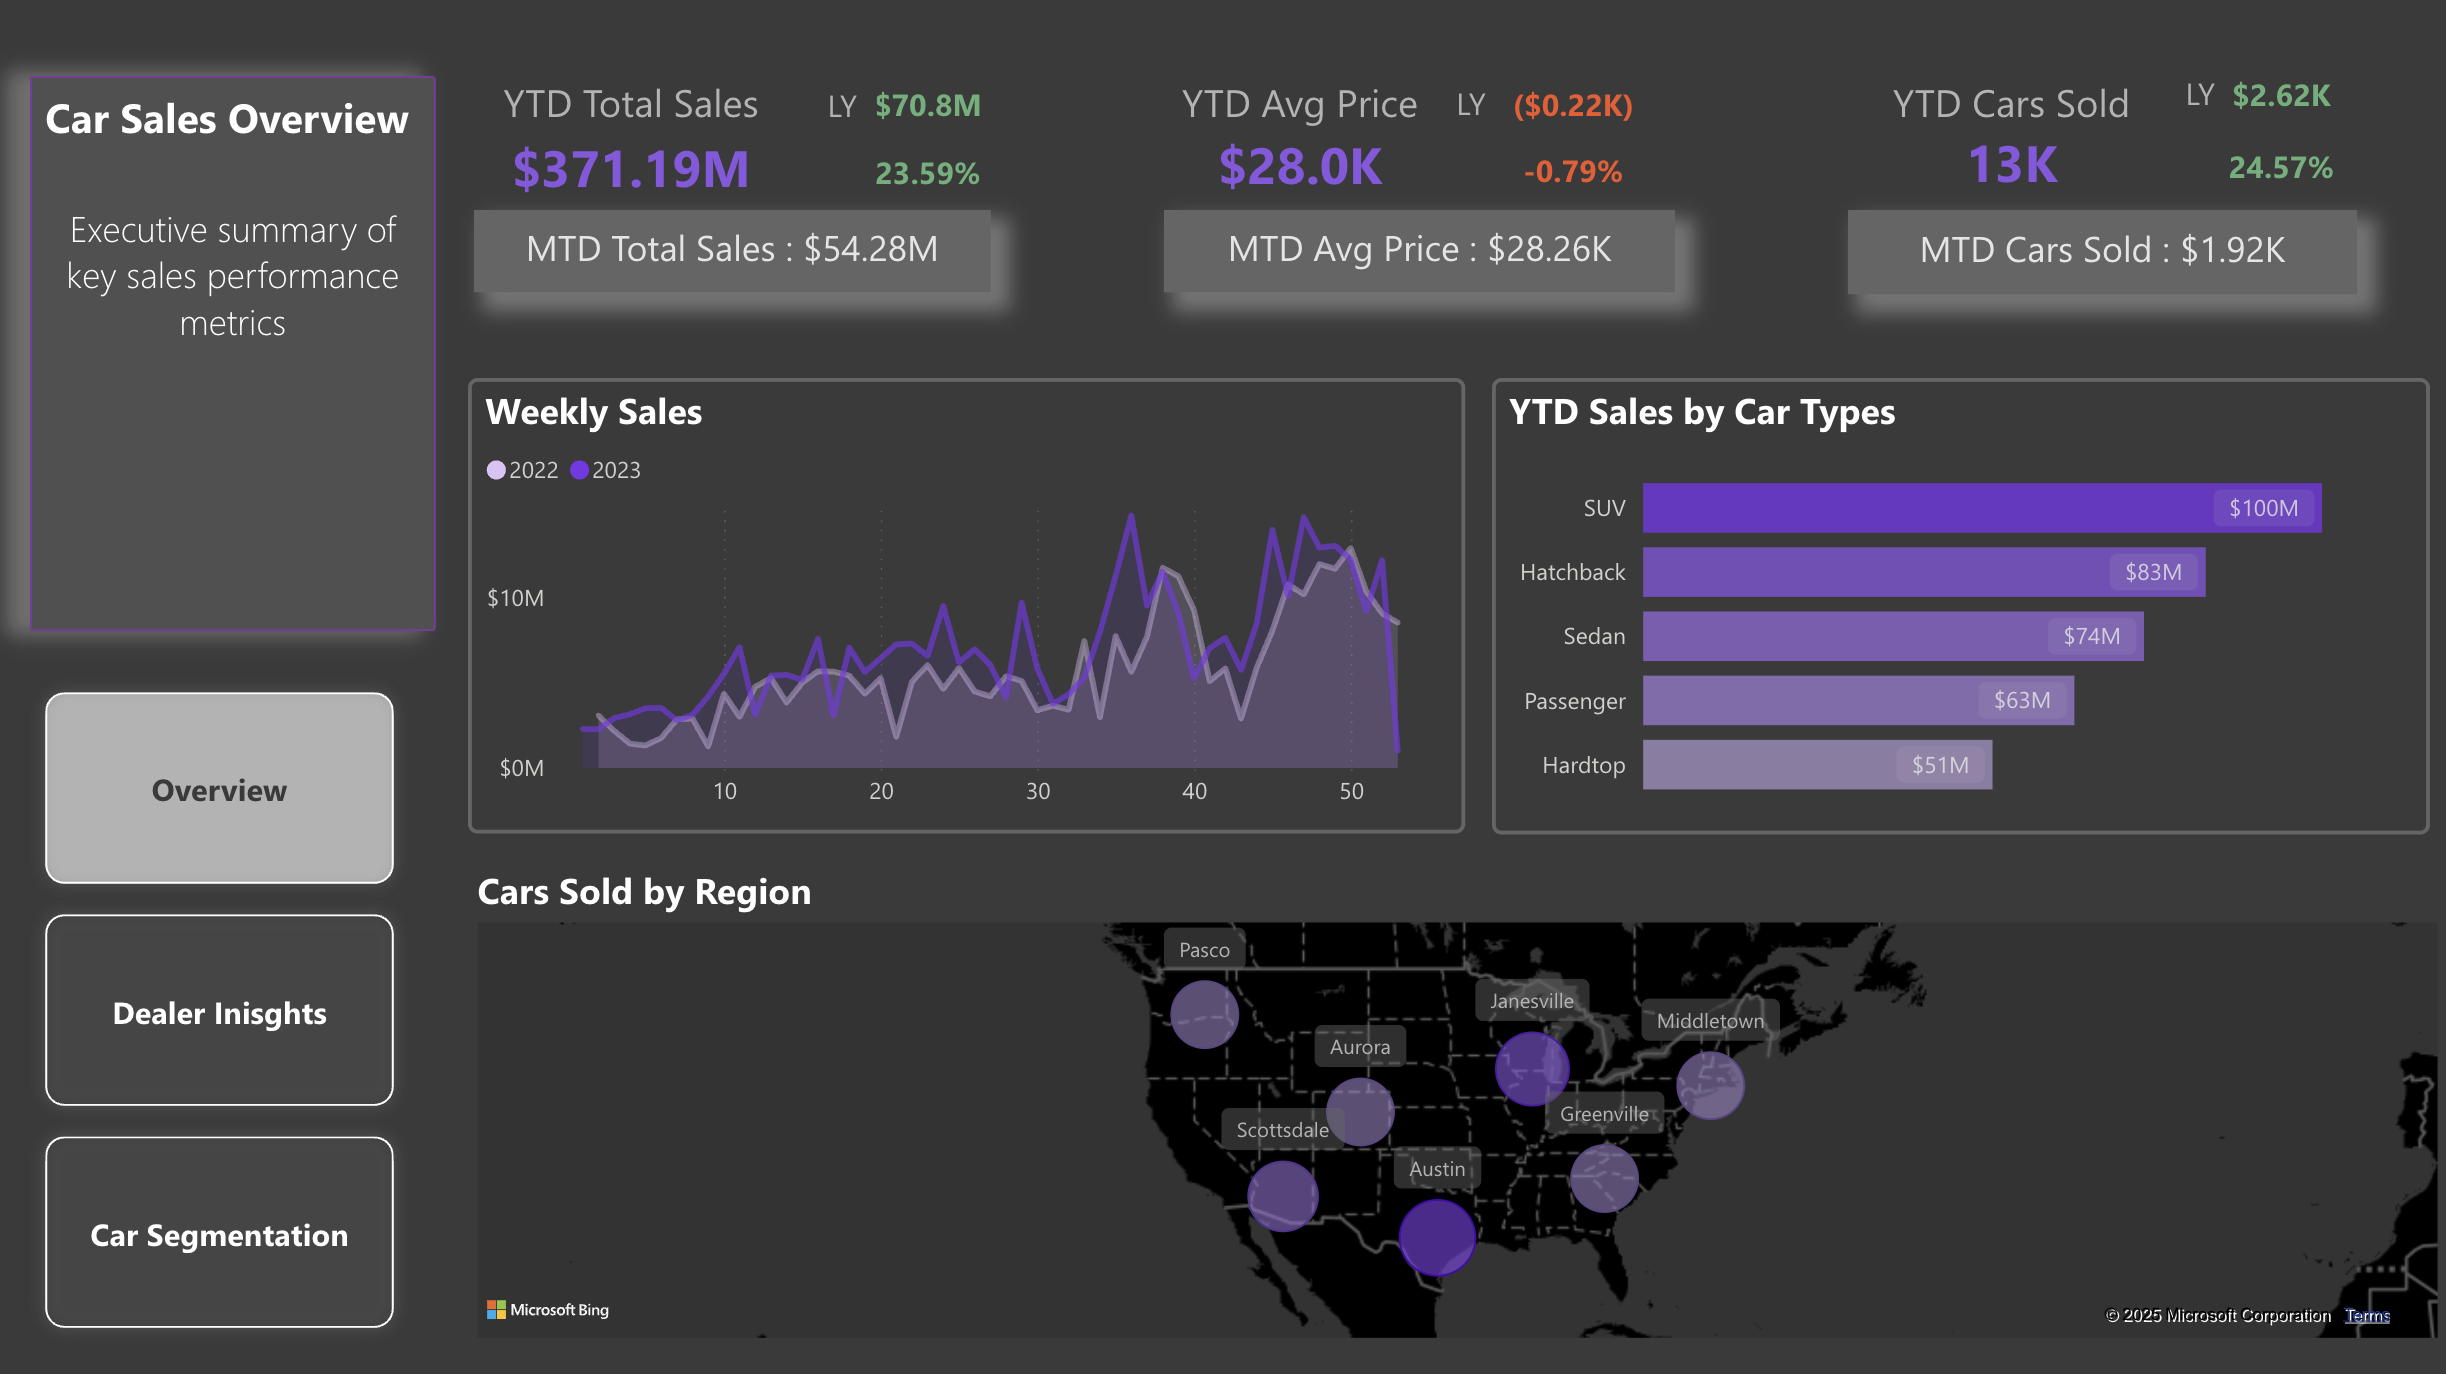
Car Sales Analysis
- Analysed 23K+ sales records to identify top revenue drivers, high-demand regions, and dealer performance opportunities.
- Built an interactive dashboard with KPIs highlighting 23.59% YoY growth, pricing trends, and dealer efficiency for strategic planning.
- Evaluated income-based spending patterns across car types to inform segmentation and targeted pricing strategies.
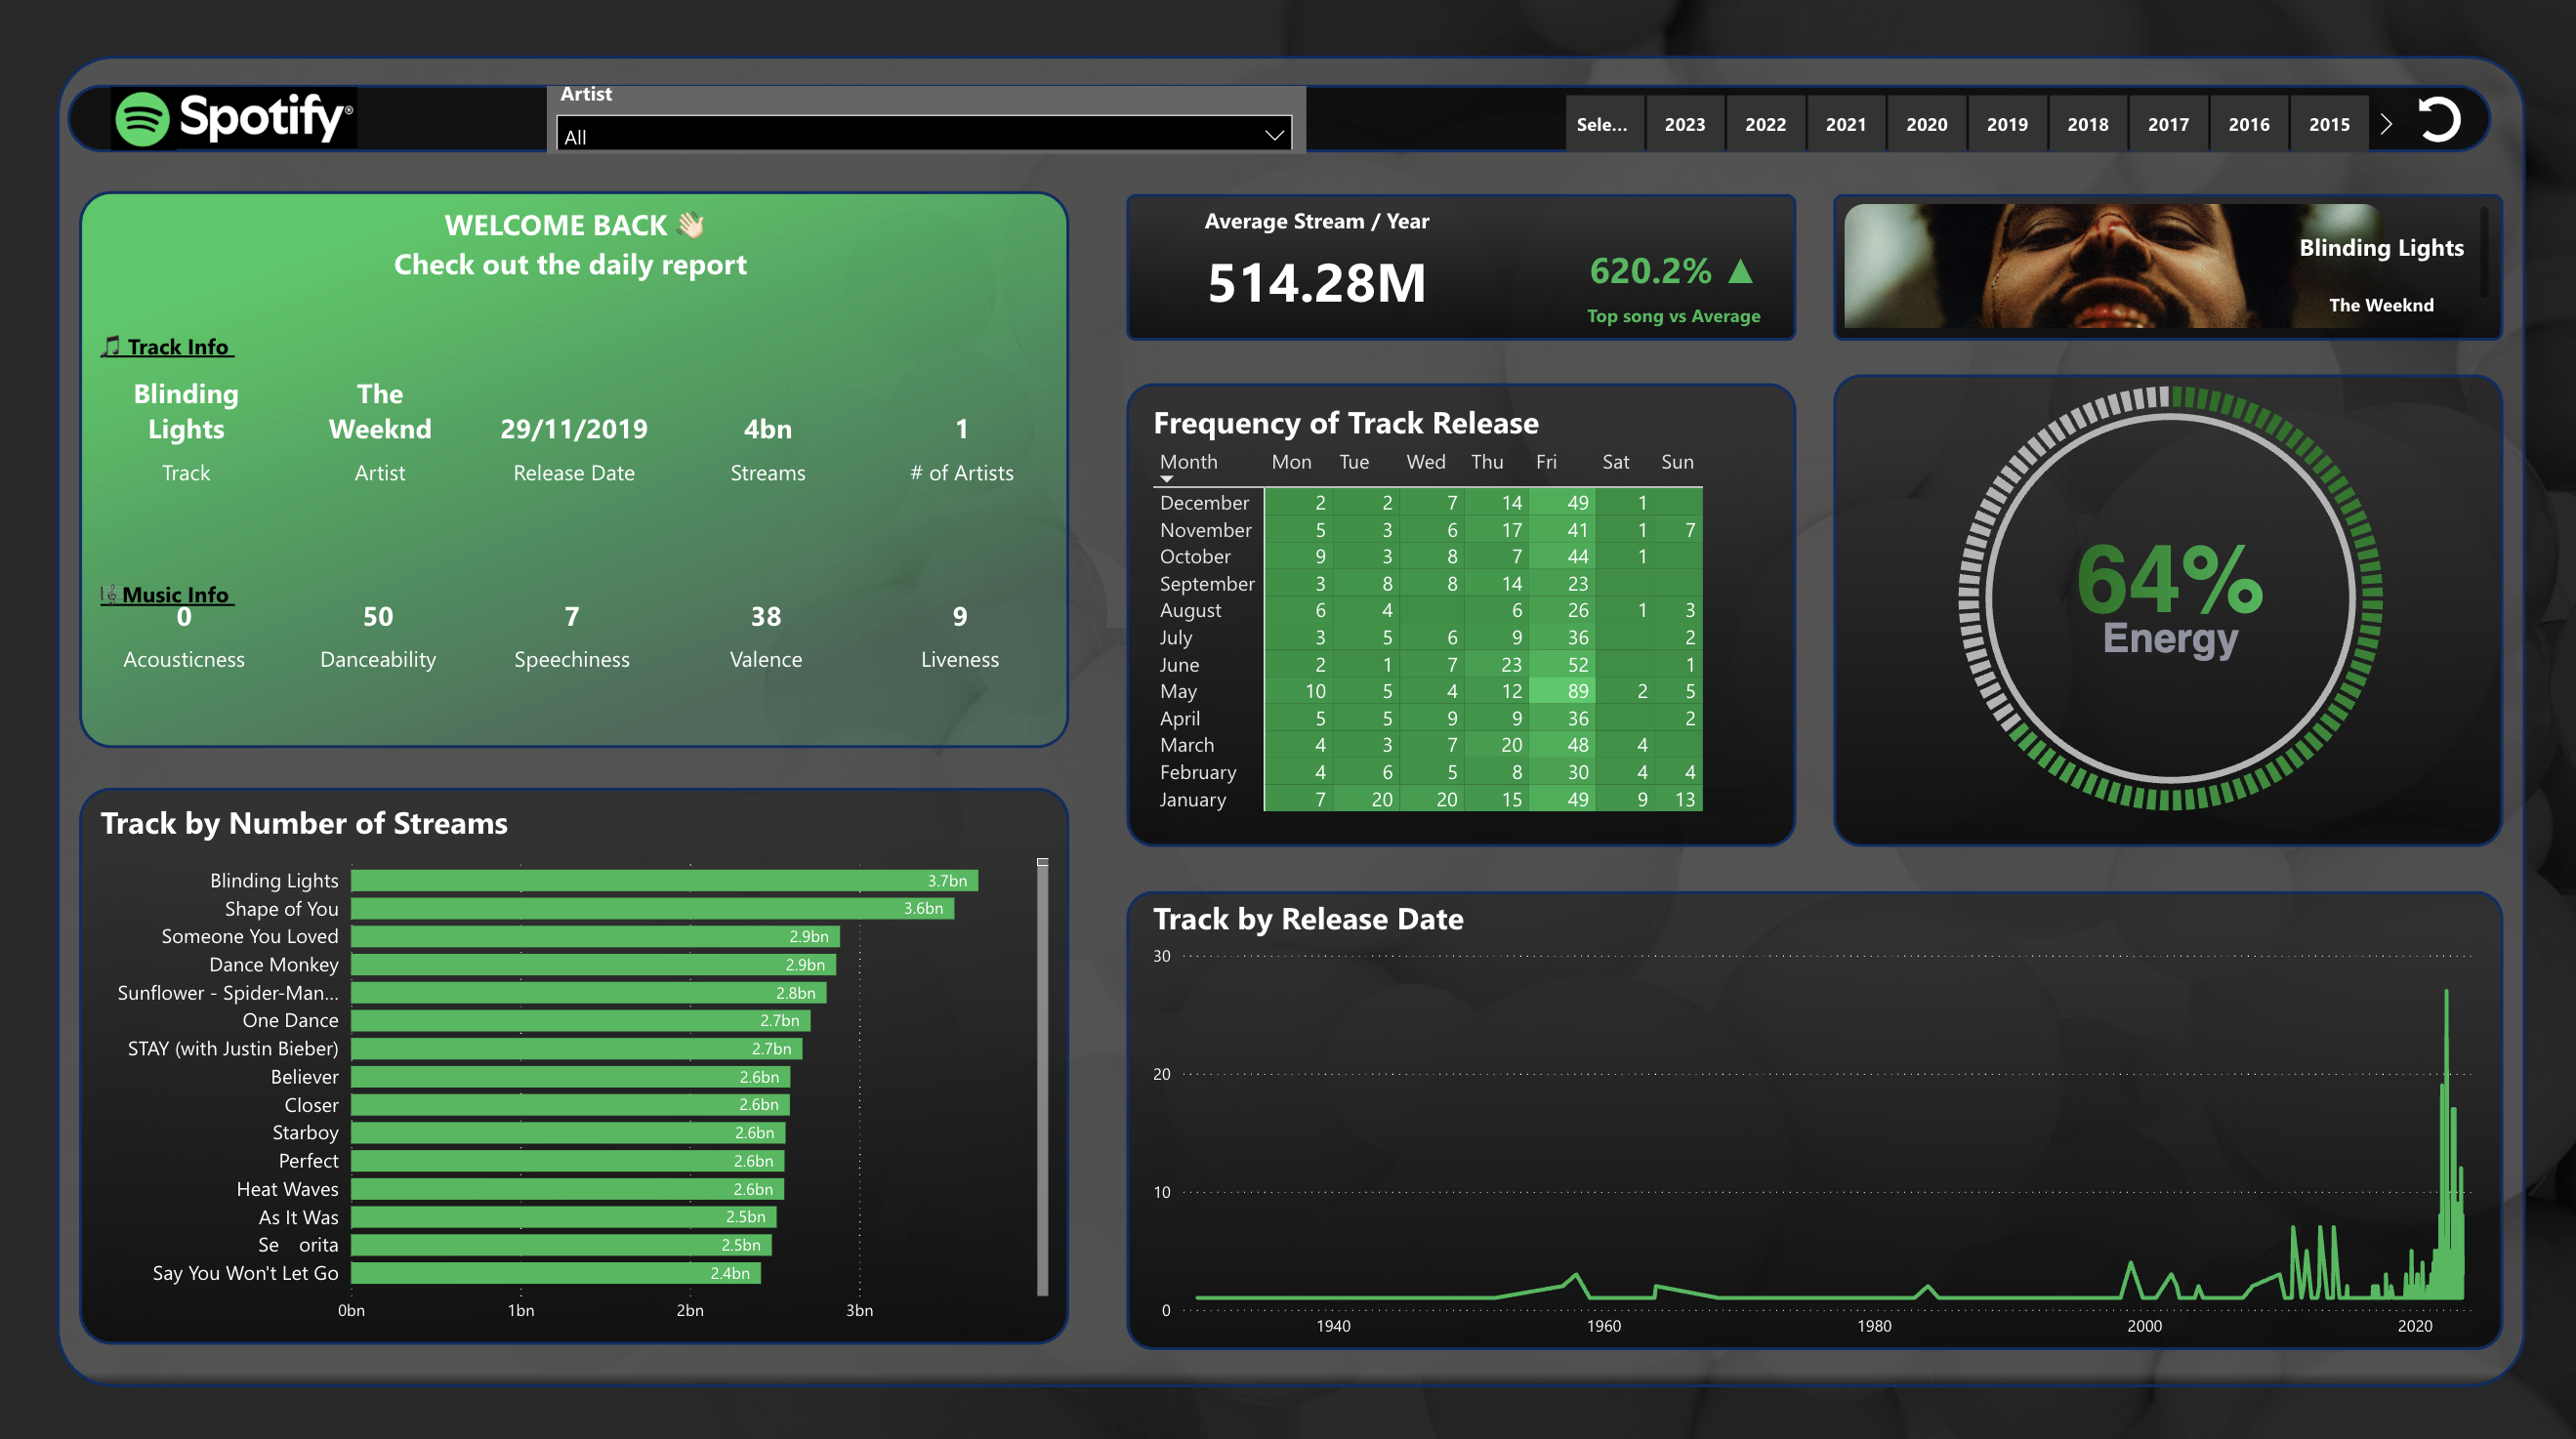
Spotify Analysis
- Used Python to prepare the dataset to remove duplicates, fix missing values, and standardise track metadata for accurate analysis.
- Built an interactive dashboard analysing top-streamed songs, yearly streaming trends, and release-month patterns, highlighting 514M avg annual streams and key drivers of track popularity.
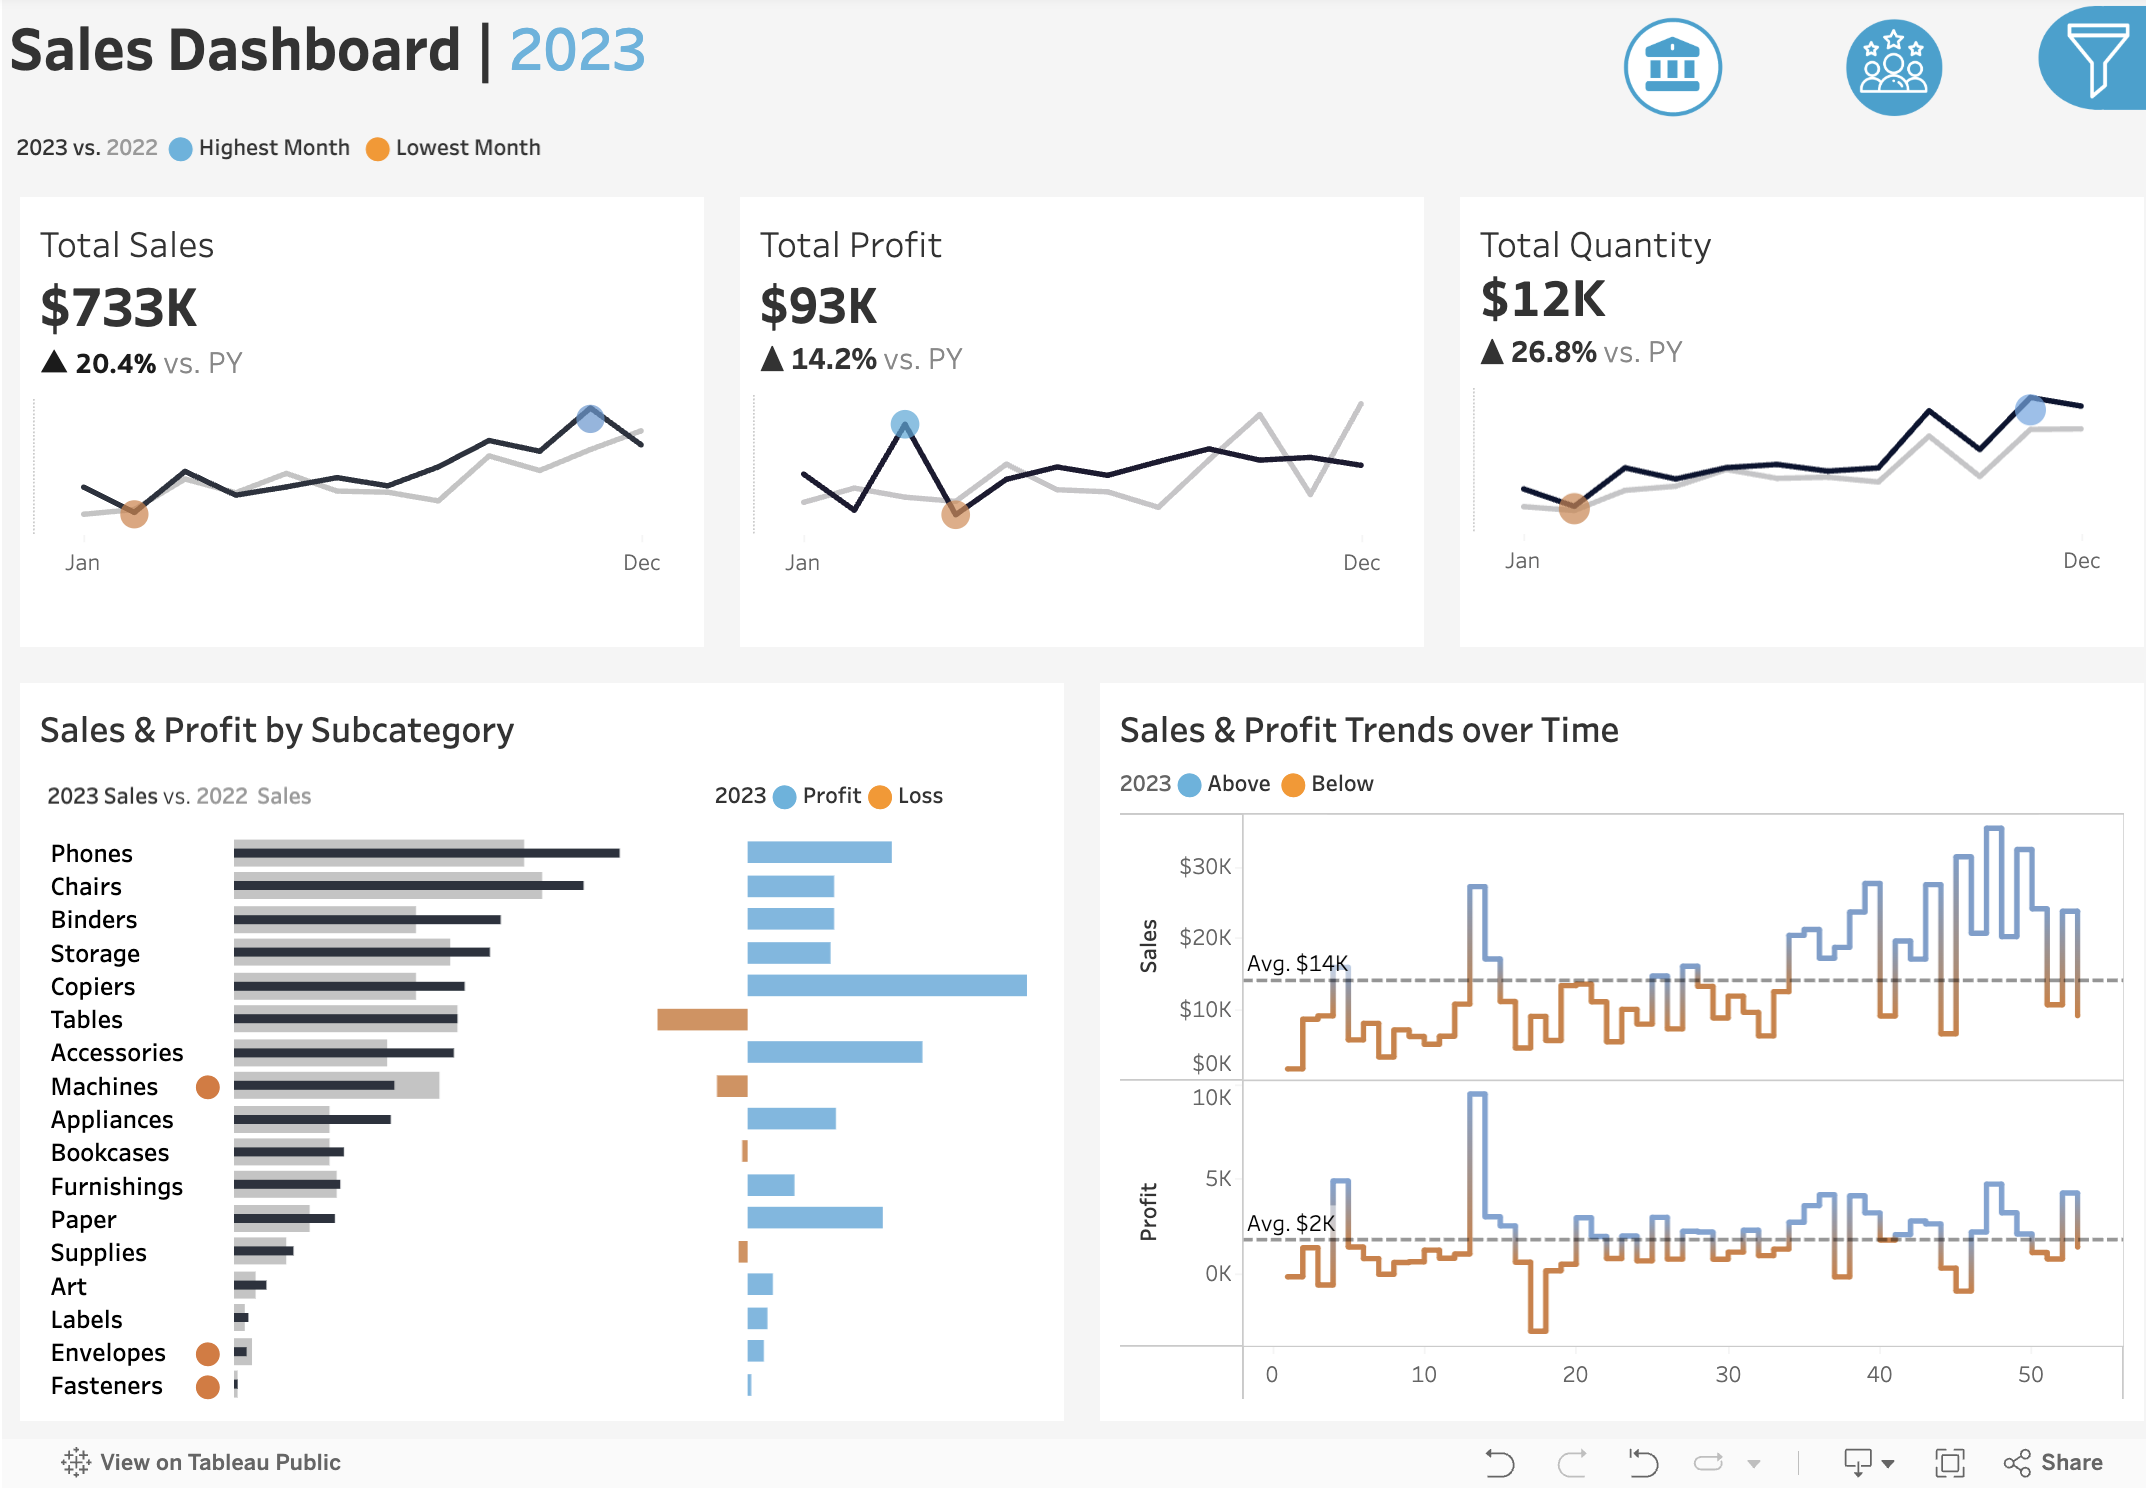
Retail Sales Analysis
- Prepared the dataset using Excel Power Query, enabling accurate analysis of YoY sales, profit trends, and customer behaviour.
- Highlighted 20% YoY sales growth, profit fluctuations, and subcategories driving performance or losses across the product portfolio.
- Identified high-value customer segments through analysing purchase patterns and profit contribution, informing targeted retention and upselling actions.
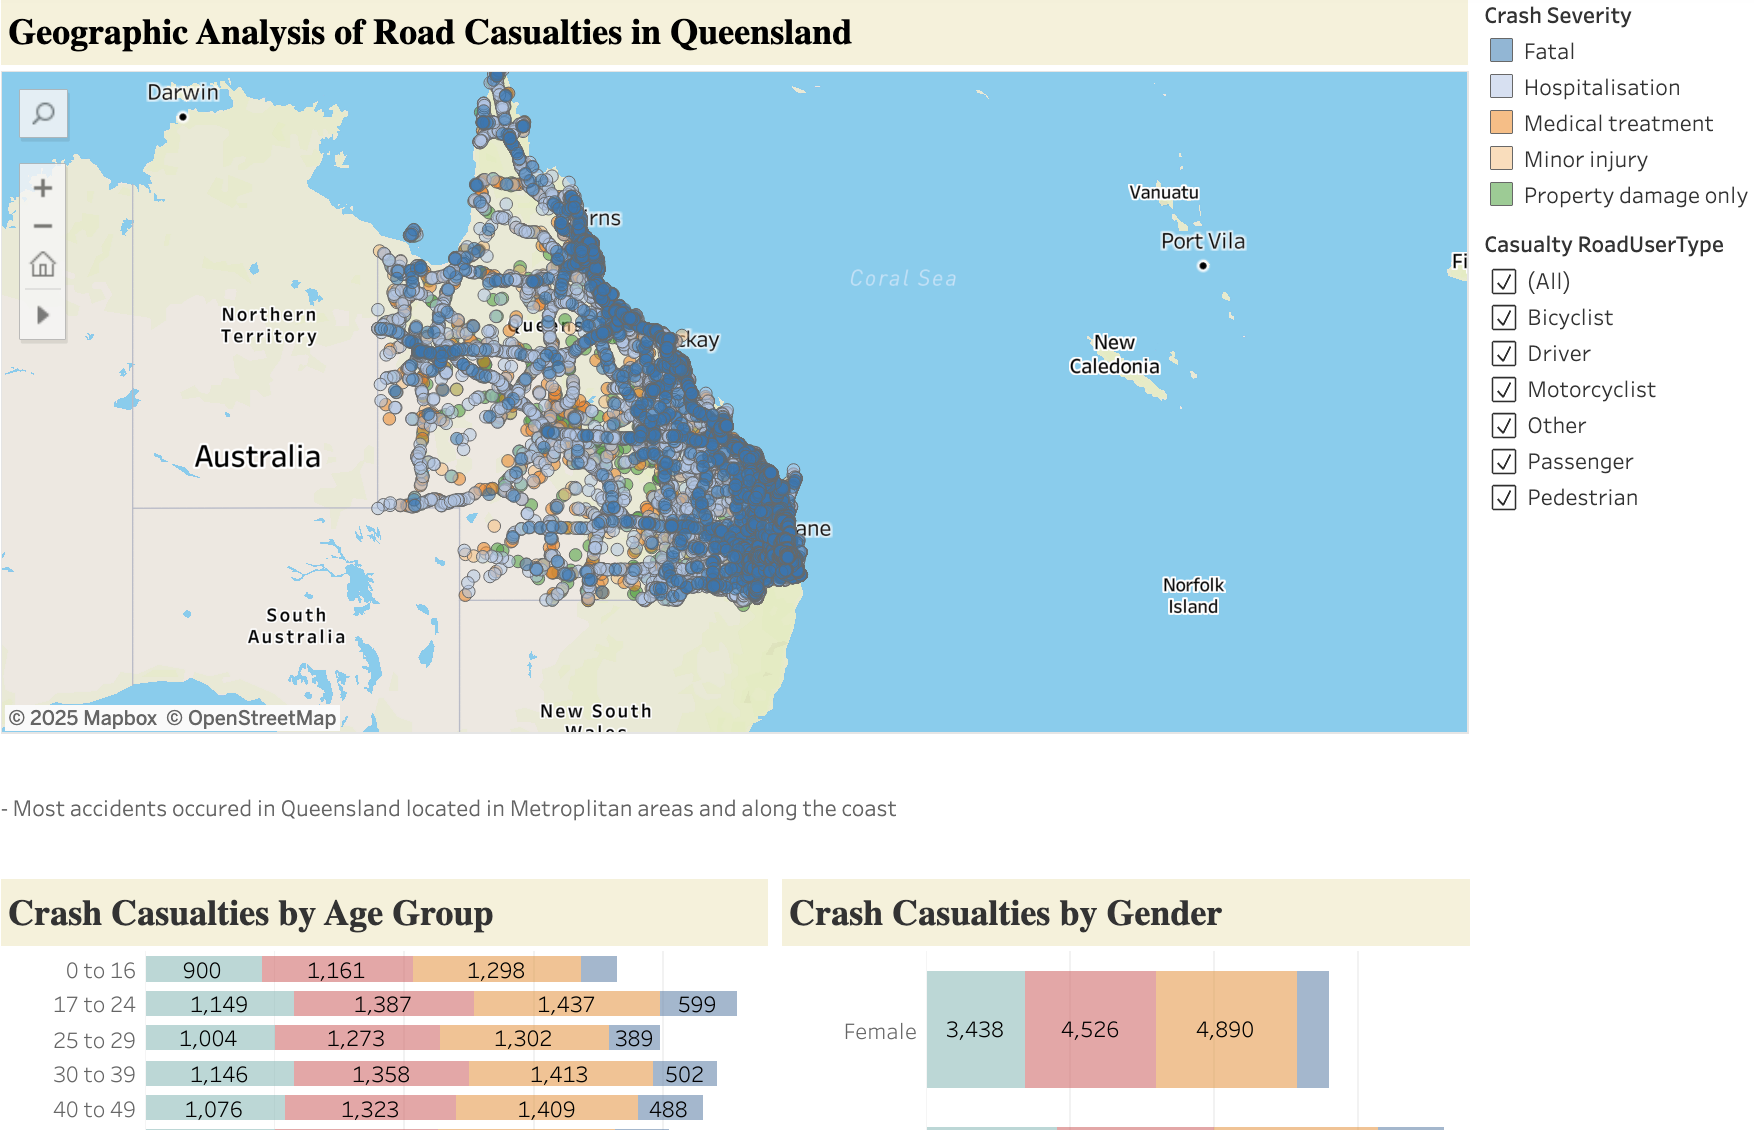
Queensland Road Traffic Crashes Analysis
- Analysed 20+ years Queensland crash records to observe long-term trends, showing overall reductions after 2010 and consistent differences between human-harm and property-damage incidents.
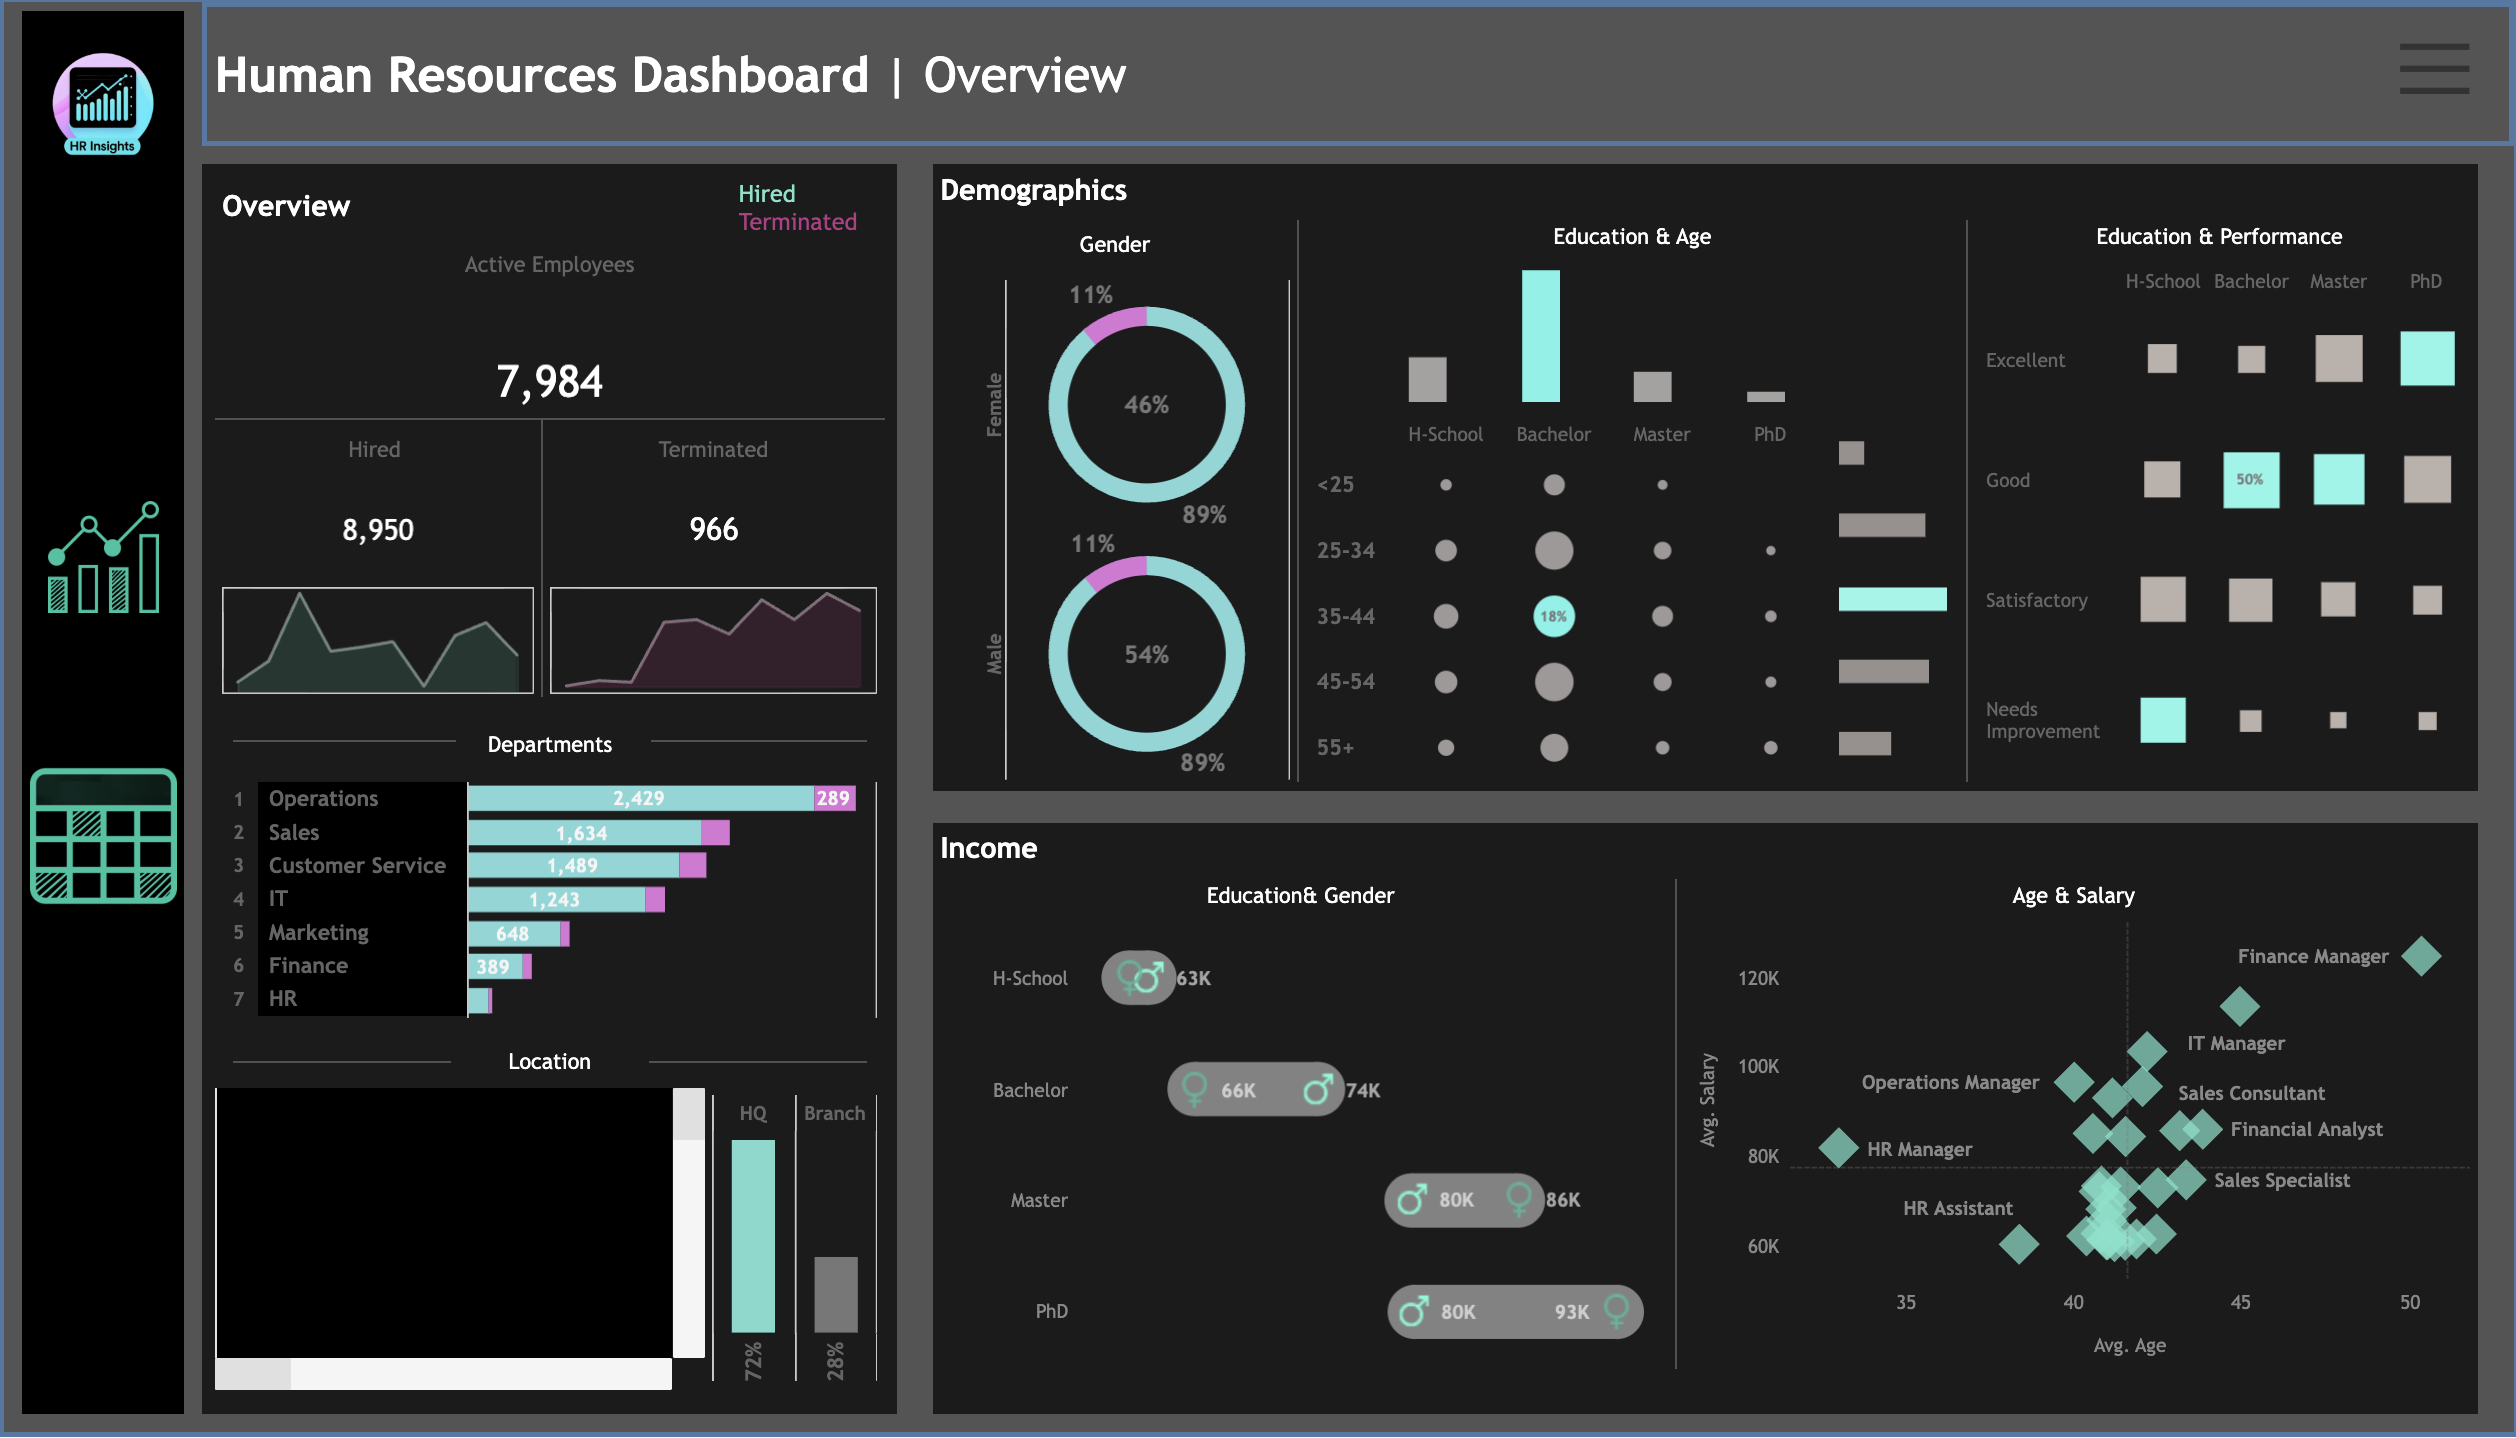
Human Resources Analysis
- Analysed workforce data for 8.9K+ employees to reveal demographic patterns, departmental headcount distribution, and salary differences across education levels, age groups, and genders.
- Identified compensation patterns across roles, education levels, and age groups, providing evidence to support more informed workforce planning and retention strategy.
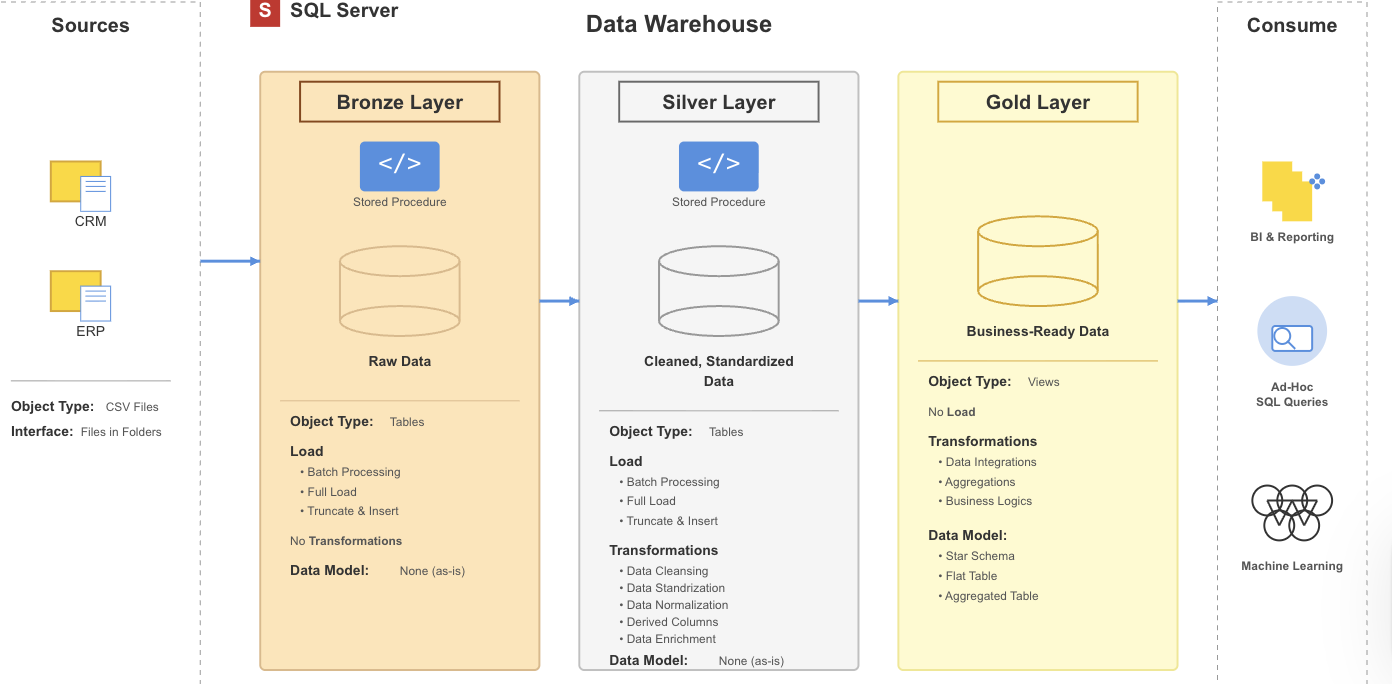
Full-Cycle Data Warehouse Development
- Built a full ETL pipeline and star-schema data warehouse integrating ERP and CRM datasets to support business insights.
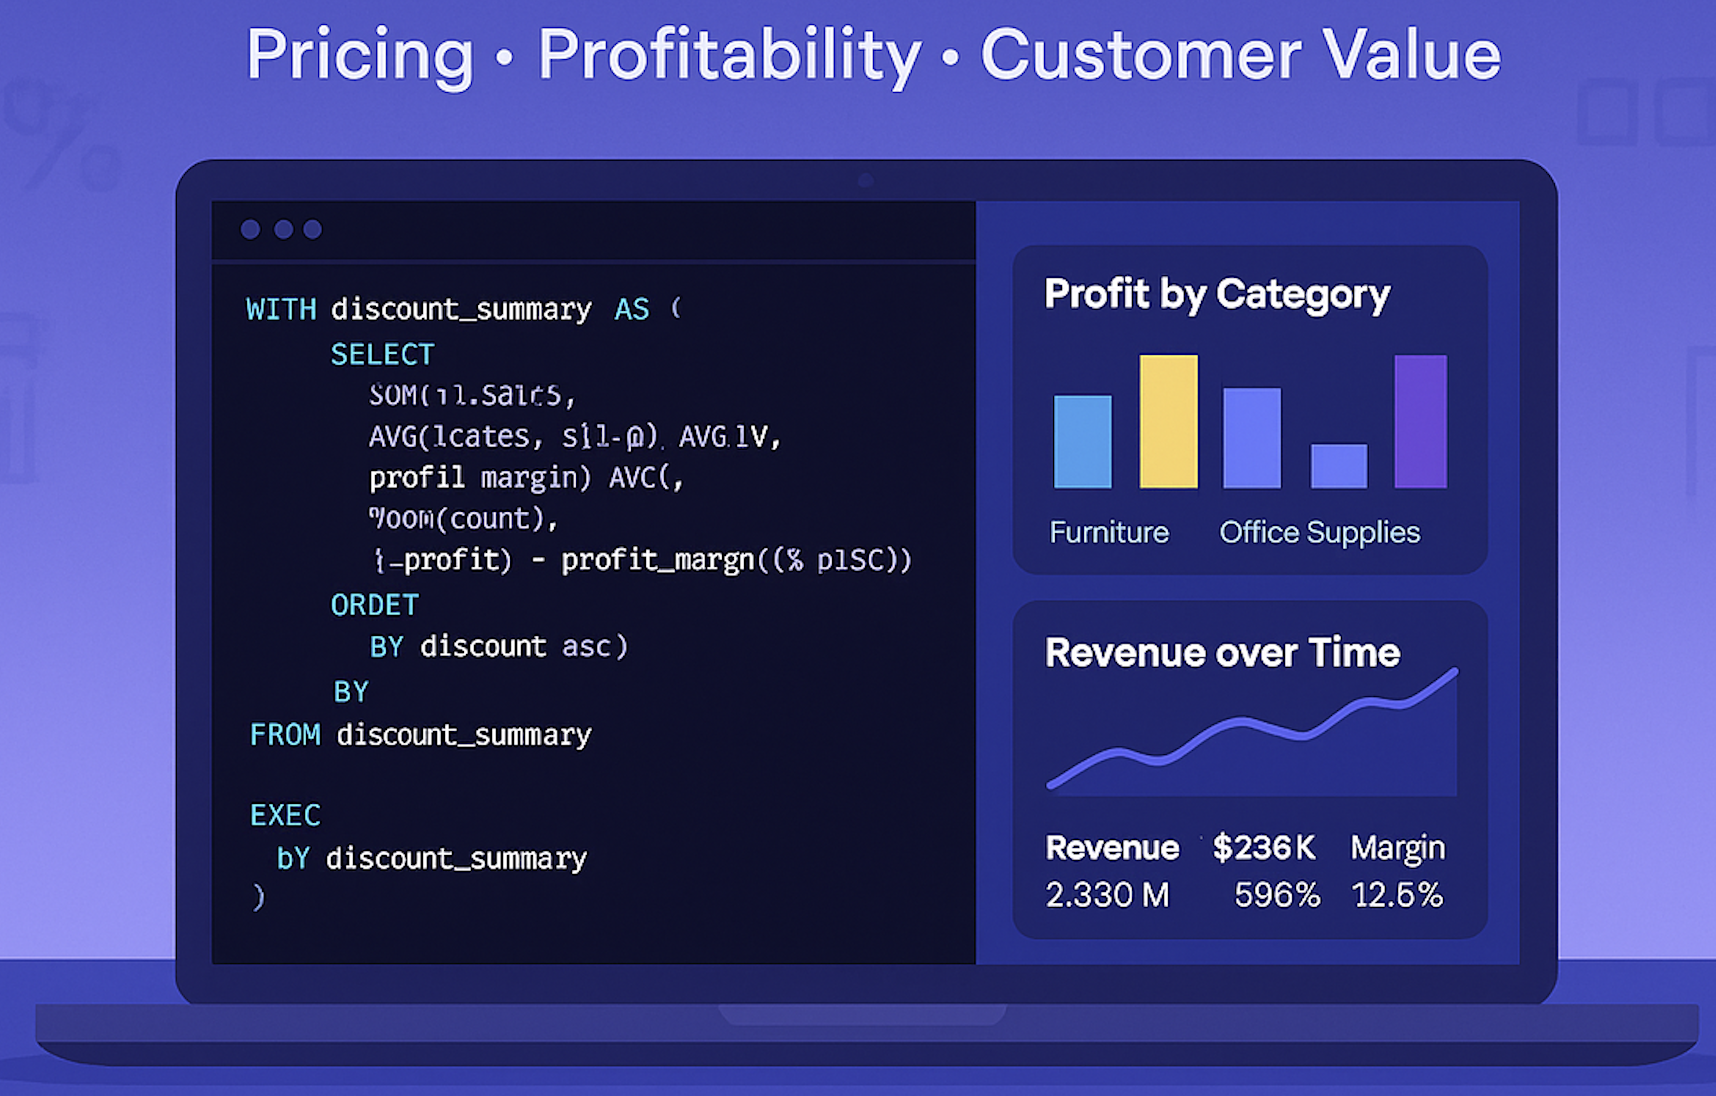
E-commerce Sales SQL Analysis
- Built an end-to-end SQL analytics model in PostgreSQL on a 10k-line E-commerce sales dataset, using CTEs, window functions and corr to unify customer, product, order and shipping performance.
- Identified profit drivers and leakages by segment, region, category, discount band and loyalty tier, turning insights into concrete pricing, assortment and loyalty strategies to improve margins and customer lifetime value.
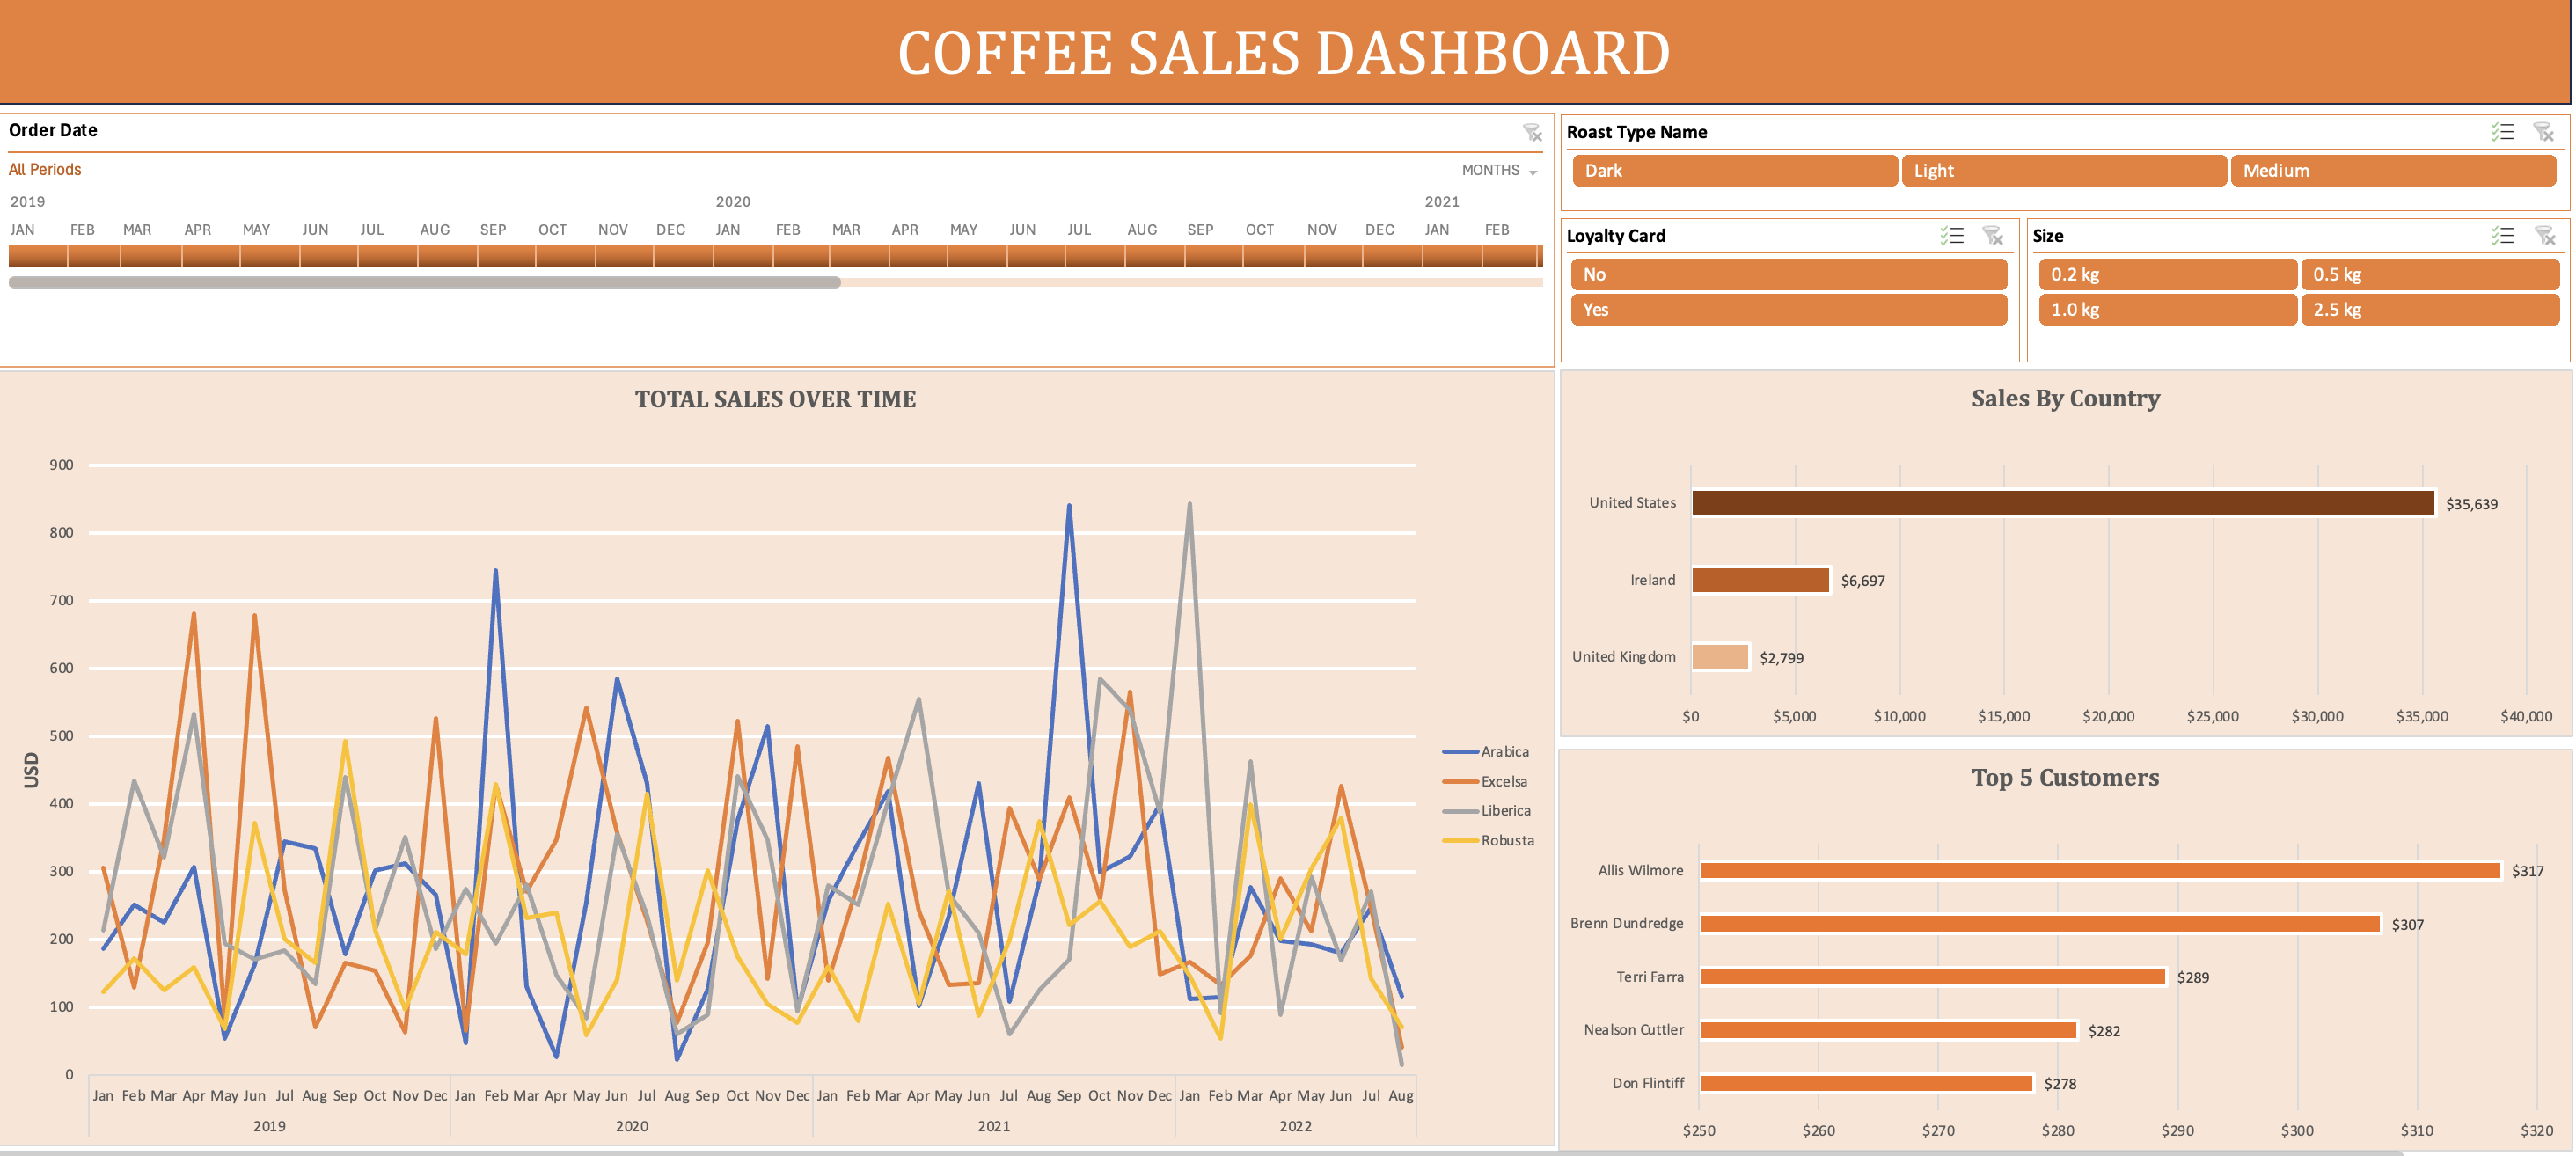
Coffee Sales Performance Analysis
- Analysed 1K+ orders to uncover seasonal revenue trends, top-value customers and peak-demand periods.
- Examined sales across markets and product categories to understand overall revenue contribution and product performance.
- Reviewed customer purchasing patterns to identify consistent buyers and opportunities to strengthen engagement and retention.
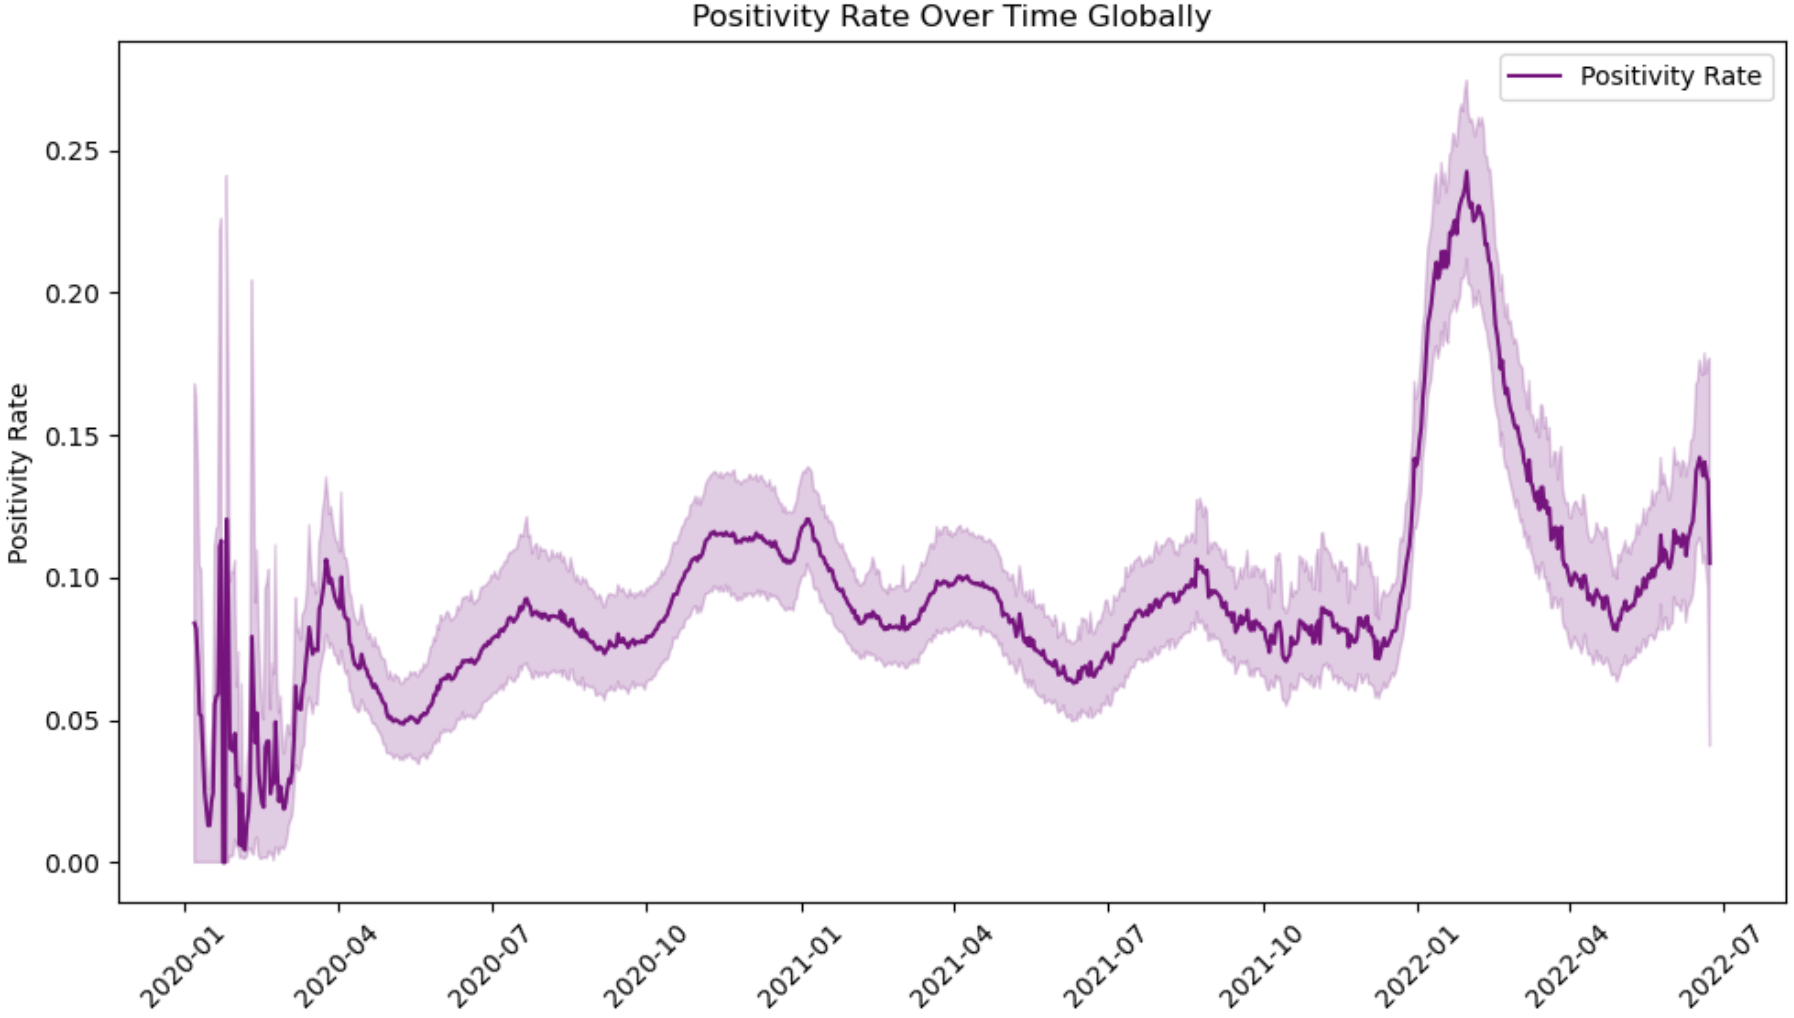
Australian Covid-19 Report
- Applied descriptive statistics, clustering, and hypothesis testing to examine how demographic, socioeconomic, and policy factors influenced case numbers, mortality, and vaccination outcomes.
- Built predictive and explanatory models (K-Means, OLS, XGBoost + SHAP) to identify key drivers of mortality and demonstrate the impact of vaccination on severe cases and high-risk populations.
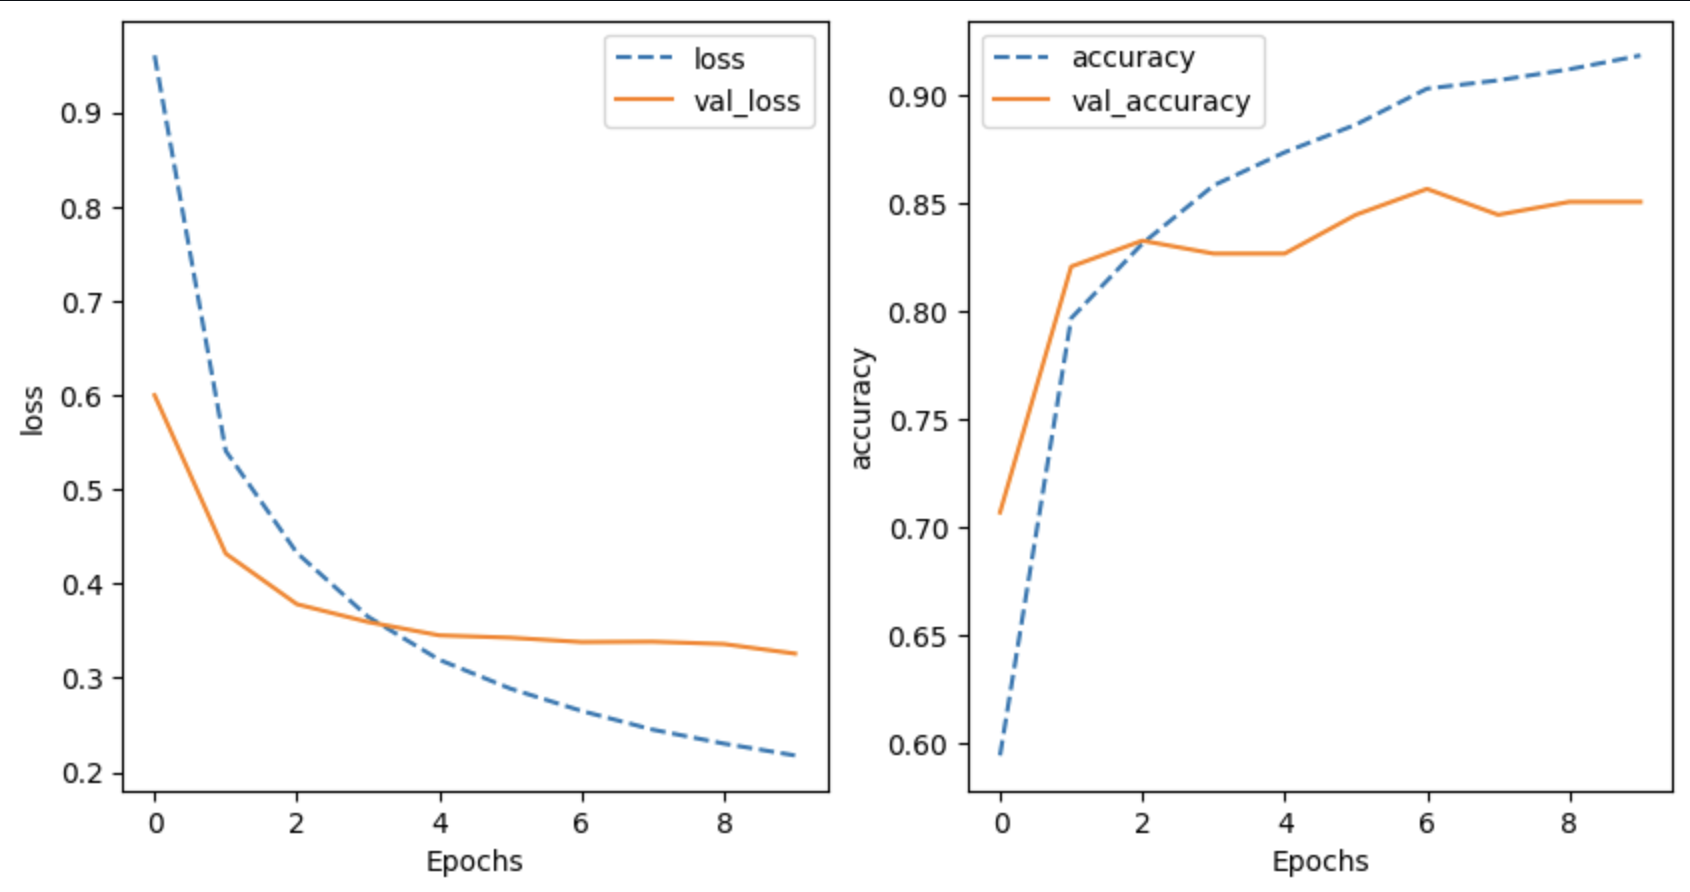
Machine Learning Projects
- Developed and evaluated Machine Learning solutions across NLP, spatial data, and image classification.
Quantium Retail Analytics — Chips Category Performance
- Analysed supermarket chips category data end-to-end in Python (pandas, numpy, matplotlib, scipy), from cleaning and customer segmentation through to deep dives on high-value cohorts and SKU/pack-size preferences.
- Designed and evaluated a store-layout trial using control-store selection, correlation-based matching and uplift significance testing, then translated results into a concise, executive-ready recommendations deck for targeted rollout and category growth.
Contact
Let’s work together to turn raw data into meaningful insights that drive real impact.